What we have been anticipating for weeks has now materialized. While many factors could have triggered Bitcoin’s latest crash, analyzing them in detail won’t make the situation any easier. The essence of market analysis is in forecasting and outlining possible scenarios. We have repeatedly warned that Bitcoin cannot rise indefinitely, and it now seems increasingly likely that we are entering a new downtrend. As is often the case, this decline began under seemingly stable market conditions, catching many traders off guard.
On Sunday, reports surfaced of a $1.5 billion hack at ByBit exchange. While it’s unlikely that this event alone triggered Bitcoin’s $13,000 drop over the past few days, it may have acted as a catalyst for the long-anticipated sell-off. Now that the decline has begun and is evident to everyone, many so-called “experts” are speculating that Bitcoin could fall to $70,000, while still maintaining its bullish trend. However, as we have always maintained, Bitcoin has the potential to drop even to zero. Investors who profited during the last bull cycle now have no reason to hold onto Bitcoin. Selling for profit and waiting for the next bullish cycle remains the most logical strategy.
Bitcoin remains unregulated, meaning it can fall to any level. Some analysts believe that once there is clarity on U.S. Bitcoin reserves, the first cryptocurrency will resume its growth. However, we are highly skeptical of this scenario.
BTC/USD Daily Chart Analysis
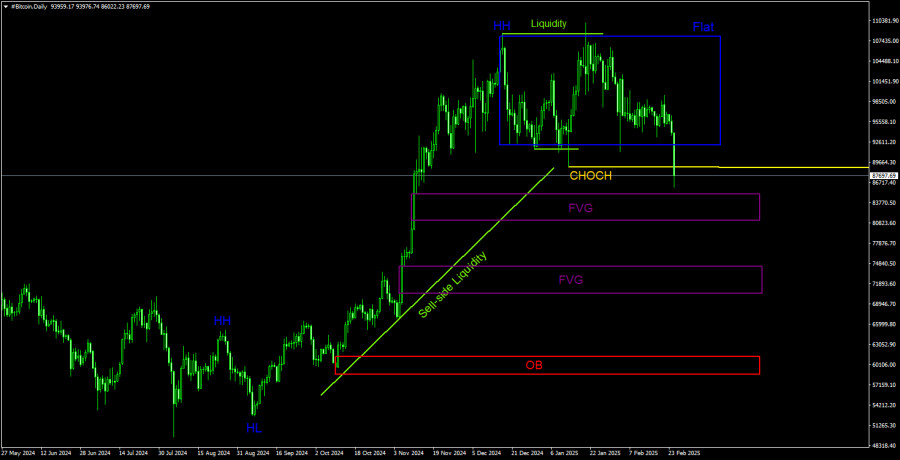
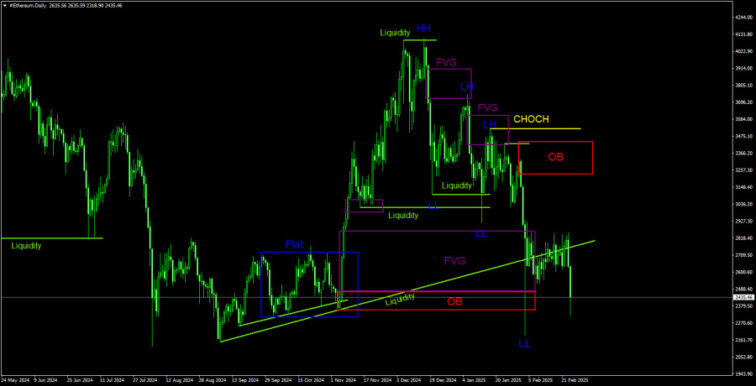
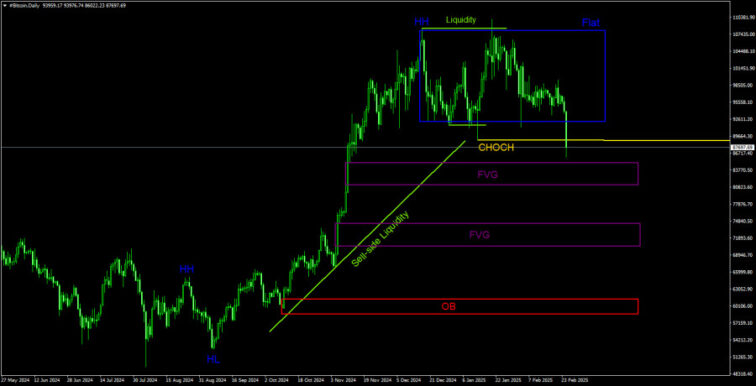
On the daily timeframe, Bitcoin now has a high probability of breaking below its range. After trading in a consolidation zone for an extended period, it is now experiencing a breakout to the downside. The CHOCH (Change of Character) line has been breached, which is the primary indicator of a trend reversal.
This suggests that a downtrend is beginning. The first downward targets are two Fair Value Gaps (FVGs). However, Bitcoin may continue falling toward the nearest Order Block (OB). If the structure officially shifts to bearish, the ideal trading strategy would be to wait for a correction before entering new short positions. This aligns with ICT system principles, which advocate selling after a corrective pullback rather than chasing price declines.
BTC/USD 4-Hour Chart Analysis
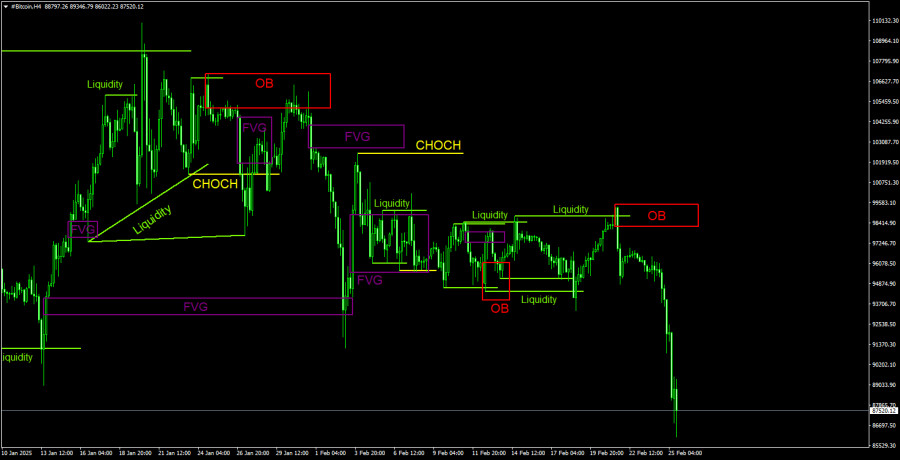
On the 4-hour timeframe, Bitcoin is experiencing a sharp sell-off. The price did not even attempt to return to the previous bearish Order Block, suggesting strong selling pressure.
One of the key warning signs before this decline was a triple liquidity sweep on the sell side. This means large players accumulated short positions by triggering Stop Loss orders placed above recent highs—a classic market-maker move.
Liquidity sweeps serve as reliable warning signals for upcoming trend reversals. While patterns like Order Blocks (OBs) and Fair Value Gaps (FVGs) are also useful, they have different functions and execution strategies.
Bitcoin Trading Strategy (BTC/USD)
At this stage, the primary expectation is for further Bitcoin declines. A correction may soon emerge, presenting new selling opportunities. However, the most critical event is the breakdown of the bullish structure, which had been forming for two years.
Historically, Bitcoin follows a boom-and-bust cycle, characterized by parabolic price increases followed by crashes of 80-90%. Given this historical pattern, we are preparing for a prolonged downtrend in Bitcoin.
Explanation of Key ICT Concepts in the Chart
- CHOCH (Change of Character) – A key signal of a trend reversal.
- Liquidity – Stop Loss levels that market makers exploit to build their positions.
- FVG (Fair Value Gap) – A price inefficiency zone where price moves too quickly, indicating a lack of buyers or sellers. The price often revisits these areas before continuing its trend.
- IFVG (Inverse Fair Value Gap) – A special type of FVG where price fails to react, instead breaking through and then retesting from the other side.
- OB (Order Block) – The candle where a market maker entered a position, typically in the opposite direction of the market’s prior move.
The material has been provided by InstaForex Company – www.instaforex.comWhat we have been anticipating for weeks has now materialized. While many factors could have triggered Bitcoin’s latest crash, analyzing them in detail won’t make the situation any easier. The essence of market analysis is in forecasting and outlining possible scenarios. We have repeatedly warned that Bitcoin cannot rise indefinitely, and it now seems increasingly likely that we are entering a new downtrend. As is often the case, this decline began under seemingly stable market conditions, catching many traders off guard.On Sunday, reports surfaced of a $1.5 billion hack at ByBit exchange. While it’s unlikely that this event alone triggered Bitcoin’s $13,000 drop over the past few days, it may have acted as a catalyst for the long-anticipated sell-off. Now that the decline has begun and is evident to everyone, many so-called “experts” are speculating that Bitcoin could fall to $70,000, while still maintaining its bullish trend. However, as we have always maintained, Bitcoin has the potential to drop even to zero. Investors who profited during the last bull cycle now have no reason to hold onto Bitcoin. Selling for profit and waiting for the next bullish cycle remains the most logical strategy.Bitcoin remains unregulated, meaning it can fall to any level. Some analysts believe that once there is clarity on U.S. Bitcoin reserves, the first cryptocurrency will resume its growth. However, we are highly skeptical of this scenario.BTC/USD Daily Chart Analysis On the daily timeframe, Bitcoin now has a high probability of breaking below its range. After trading in a consolidation zone for an extended period, it is now experiencing a breakout to the downside. The CHOCH (Change of Character) line has been breached, which is the primary indicator of a trend reversal.This suggests that a downtrend is beginning. The first downward targets are two Fair Value Gaps (FVGs). However, Bitcoin may continue falling toward the nearest Order Block (OB). If the structure officially shifts to bearish, the ideal trading strategy would be to wait for a correction before entering new short positions. This aligns with ICT system principles, which advocate selling after a corrective pullback rather than chasing price declines.BTC/USD 4-Hour Chart Analysis On the 4-hour timeframe, Bitcoin is experiencing a sharp sell-off. The price did not even attempt to return to the previous bearish Order Block, suggesting strong selling pressure.One of the key warning signs before this decline was a triple liquidity sweep on the sell side. This means large players accumulated short positions by triggering Stop Loss orders placed above recent highs—a classic market-maker move.Liquidity sweeps serve as reliable warning signals for upcoming trend reversals. While patterns like Order Blocks (OBs) and Fair Value Gaps (FVGs) are also useful, they have different functions and execution strategies.Bitcoin Trading Strategy (BTC/USD)At this stage, the primary expectation is for further Bitcoin declines. A correction may soon emerge, presenting new selling opportunities. However, the most critical event is the breakdown of the bullish structure, which had been forming for two years.Historically, Bitcoin follows a boom-and-bust cycle, characterized by parabolic price increases followed by crashes of 80-90%. Given this historical pattern, we are preparing for a prolonged downtrend in Bitcoin.Explanation of Key ICT Concepts in the ChartCHOCH (Change of Character) – A key signal of a trend reversal.Liquidity – Stop Loss levels that market makers exploit to build their positions.FVG (Fair Value Gap) – A price inefficiency zone where price moves too quickly, indicating a lack of buyers or sellers. The price often revisits these areas before continuing its trend.IFVG (Inverse Fair Value Gap) – A special type of FVG where price fails to react, instead breaking through and then retesting from the other side.OB (Order Block) – The candle where a market maker entered a position, typically in the opposite direction of the market’s prior move.The material has been provided by InstaForex Company – www.instaforex.com Read More
Forex analysis review