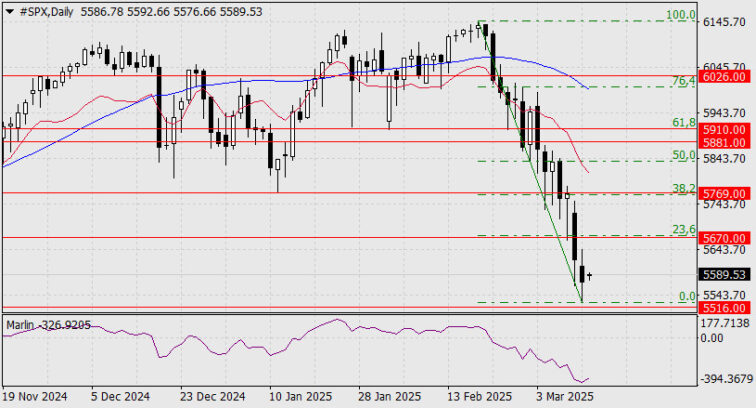
Yesterday, the U.S. stock index S&P 500 declined by 0.76%, approaching the target support level of 5516, indicated by its lower shadow. The Marlin oscillator has turned upward from the oversold zone. Meanwhile, the Russell 2000 index, which often serves as a leading indicator for the S&P 500, rose by 0.09% yesterday. Today, Asian markets have started with gains.
The price is likely heading toward the 23.6% Fibonacci level, which coincides with the target level of 5670 (the peak of July 2024). A breakout above this level would open up the next corrective target at 38.2%, around the 5769 level (the January 2025 low).
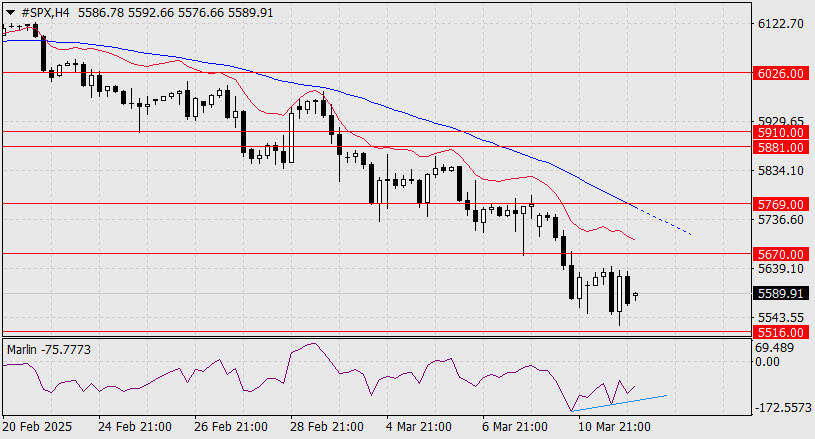
On the four-hour chart, both the price and the Marlin oscillator have formed a minor convergence. We expect the price to reach the first corrective level of 5670 or slightly higher, while testing the MACD line.
The material has been provided by InstaForex Company – www.instaforex.comYesterday, the U.S. stock index S&P 500 declined by 0.76%, approaching the target support level of 5516, indicated by its lower shadow. The Marlin oscillator has turned upward from the oversold zone. Meanwhile, the Russell 2000 index, which often serves as a leading indicator for the S&P 500, rose by 0.09% yesterday. Today, Asian markets have started with gains. The price is likely heading toward the 23.6% Fibonacci level, which coincides with the target level of 5670 (the peak of July 2024). A breakout above this level would open up the next corrective target at 38.2%, around the 5769 level (the January 2025 low).On the four-hour chart, both the price and the Marlin oscillator have formed a minor convergence. We expect the price to reach the first corrective level of 5670 or slightly higher, while testing the MACD line. The material has been provided by InstaForex Company – www.instaforex.com Read More
Forex analysis review