On Monday, the GBP/USD currency pair continued to lean toward growth. There were no significant events in the UK throughout the day, while in the U.S., only one report was released, which was not the cause of the new decline in the U.S. dollar. The movement in GBP/USD now resembles inertia—where the market continues to buy simply because the currency keeps rising. But what has been driving the pound’s recent gains? The UK economy has once again contracted, and industrial production has declined. The Bank of England is not planning to cut interest rates this week, nor is the Federal Reserve. Both rates currently stand at 4.5%. If neither central bank intends to cut rates, why is only the pound rising?
The U.S. economy could face a recession due to Donald Trump’s policies—a real possibility. However, moving from 2–3% quarterly growth to a recession is still a long way off. In contrast, the UK will likely face fewer hurdles in reaching that point as its economy continues to show either minimal growth or no growth. Trump’s economic aggression may bypass the UK. However, even the current trade wars with China and Canada are enough to slow down the global economy. And if the global economy slows down, so will the British economy.
Thus, whether the BoE lowers rates or not is irrelevant. The UK economy has nothing to boast about compared to the U.S. economy. However, as already mentioned, there is no apparent reason for the dollar’s decline. If one ignores all the positive fundamental and macroeconomic factors favoring the dollar, the British currency could continue to rise for another year or two. But what’s the issue? In our analyses, we try to consider all factors, and when a movement appears illogical, we call it as it is—”illogical.” We don’t try to come up with justifications for why it’s happening. In hindsight, any movement can be explained using the classic “rise in risk-on/risk-off sentiment” narrative. But does it help anyone to read about “rising risk appetite” while watching price movements? And how can one predict such a rise in risk appetite in advance? How long will it last?
That’s why we either provide forecasts explaining our expectations or highlight inconsistencies between market fundamentals and current price action. For example, at this point, trading should be based purely on technicals using timeframes of four hours and below. This week, the Fed and the BoE are set to meet, but we cannot predict their rhetoric or how the market will react. The pound continues to climb persistently and doesn’t need news to support its growth.
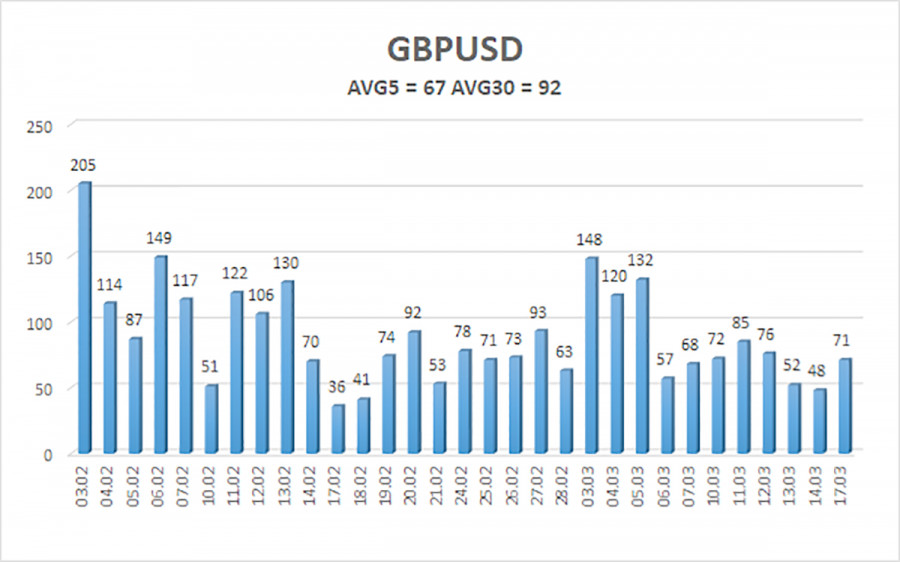
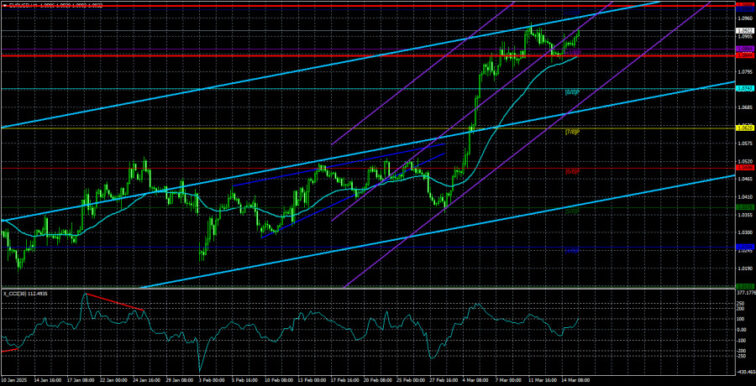
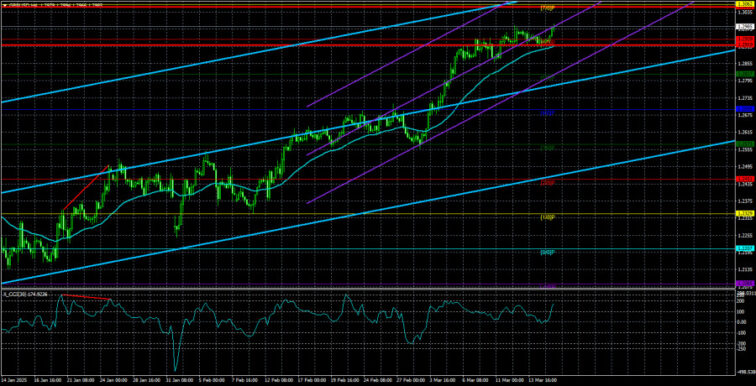
The average volatility of the GBP/USD pair over the past five trading days stands at 67 pips, which is considered “moderate to low” for this pair. On Tuesday, March 18, we expect the pair to move between 1.2919 and 1.3053. The long-term regression channel has turned upward, but the downtrend remains intact, as seen in the daily timeframe. The CCI indicator has not recently entered overbought or oversold areas.
Nearest Support Levels:
S1 – 1.2939
S2 – 1.2817
S3 – 1.2695
Nearest Resistance Levels:
R1 – 1.3062
R2 – 1.3184
R3 – 1.3306
Trading Recommendations:
The GBP/USD currency pair maintains a medium-term downtrend. We still do not consider long positions, as we view the current upward movement as a correction that has turned into an illogical, panic-driven rally. If you are trading purely based on technical analysis, long positions are possible with targets at 1.3053 and 1.3062, provided the price stays above the moving average. However, sell orders remain far more relevant, with targets at 1.2207 and 1.2146, as the upward correction on the daily timeframe will eventually end. The pound appears extremely overbought and unjustifiably expensive, but Donald Trump continues to push the dollar into the abyss. Predicting how long this “Trump-driven” dollar collapse will last is challenging.
Explanation of Illustrations:
Linear Regression Channels help determine the current trend. If both channels are aligned, it indicates a strong trend.
Moving Average Line (settings: 20,0, smoothed) defines the short-term trend and guides the trading direction.
Murray Levels act as target levels for movements and corrections.
Volatility Levels (red lines) represent the likely price range for the pair over the next 24 hours based on current volatility readings.
CCI Indicator: If it enters the oversold region (below -250) or overbought region (above +250), it signals an impending trend reversal in the opposite direction.
The material has been provided by InstaForex Company – www.instaforex.comOn Monday, the GBP/USD currency pair continued to lean toward growth. There were no significant events in the UK throughout the day, while in the U.S., only one report was released, which was not the cause of the new decline in the U.S. dollar. The movement in GBP/USD now resembles inertia—where the market continues to buy simply because the currency keeps rising. But what has been driving the pound’s recent gains? The UK economy has once again contracted, and industrial production has declined. The Bank of England is not planning to cut interest rates this week, nor is the Federal Reserve. Both rates currently stand at 4.5%. If neither central bank intends to cut rates, why is only the pound rising?The U.S. economy could face a recession due to Donald Trump’s policies—a real possibility. However, moving from 2–3% quarterly growth to a recession is still a long way off. In contrast, the UK will likely face fewer hurdles in reaching that point as its economy continues to show either minimal growth or no growth. Trump’s economic aggression may bypass the UK. However, even the current trade wars with China and Canada are enough to slow down the global economy. And if the global economy slows down, so will the British economy.Thus, whether the BoE lowers rates or not is irrelevant. The UK economy has nothing to boast about compared to the U.S. economy. However, as already mentioned, there is no apparent reason for the dollar’s decline. If one ignores all the positive fundamental and macroeconomic factors favoring the dollar, the British currency could continue to rise for another year or two. But what’s the issue? In our analyses, we try to consider all factors, and when a movement appears illogical, we call it as it is—”illogical.” We don’t try to come up with justifications for why it’s happening. In hindsight, any movement can be explained using the classic “rise in risk-on/risk-off sentiment” narrative. But does it help anyone to read about “rising risk appetite” while watching price movements? And how can one predict such a rise in risk appetite in advance? How long will it last?That’s why we either provide forecasts explaining our expectations or highlight inconsistencies between market fundamentals and current price action. For example, at this point, trading should be based purely on technicals using timeframes of four hours and below. This week, the Fed and the BoE are set to meet, but we cannot predict their rhetoric or how the market will react. The pound continues to climb persistently and doesn’t need news to support its growth. The average volatility of the GBP/USD pair over the past five trading days stands at 67 pips, which is considered “moderate to low” for this pair. On Tuesday, March 18, we expect the pair to move between 1.2919 and 1.3053. The long-term regression channel has turned upward, but the downtrend remains intact, as seen in the daily timeframe. The CCI indicator has not recently entered overbought or oversold areas.Nearest Support Levels:S1 – 1.2939S2 – 1.2817S3 – 1.2695Nearest Resistance Levels:R1 – 1.3062R2 – 1.3184R3 – 1.3306Trading Recommendations:The GBP/USD currency pair maintains a medium-term downtrend. We still do not consider long positions, as we view the current upward movement as a correction that has turned into an illogical, panic-driven rally. If you are trading purely based on technical analysis, long positions are possible with targets at 1.3053 and 1.3062, provided the price stays above the moving average. However, sell orders remain far more relevant, with targets at 1.2207 and 1.2146, as the upward correction on the daily timeframe will eventually end. The pound appears extremely overbought and unjustifiably expensive, but Donald Trump continues to push the dollar into the abyss. Predicting how long this “Trump-driven” dollar collapse will last is challenging.Explanation of Illustrations:Linear Regression Channels help determine the current trend. If both channels are aligned, it indicates a strong trend.Moving Average Line (settings: 20,0, smoothed) defines the short-term trend and guides the trading direction.Murray Levels act as target levels for movements and corrections.Volatility Levels (red lines) represent the likely price range for the pair over the next 24 hours based on current volatility readings.CCI Indicator: If it enters the oversold region (below -250) or overbought region (above +250), it signals an impending trend reversal in the opposite direction.The material has been provided by InstaForex Company – www.instaforex.com Read More
Forex analysis review