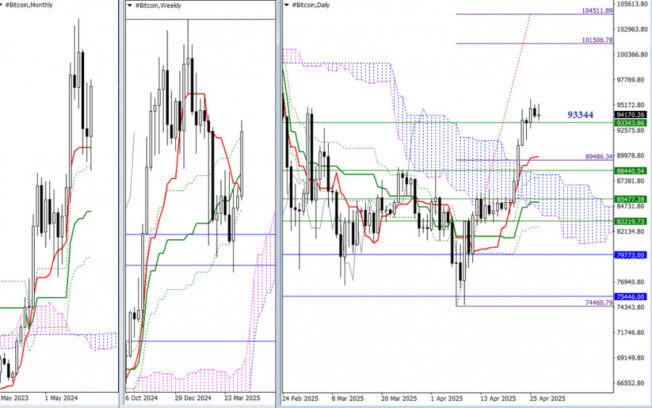
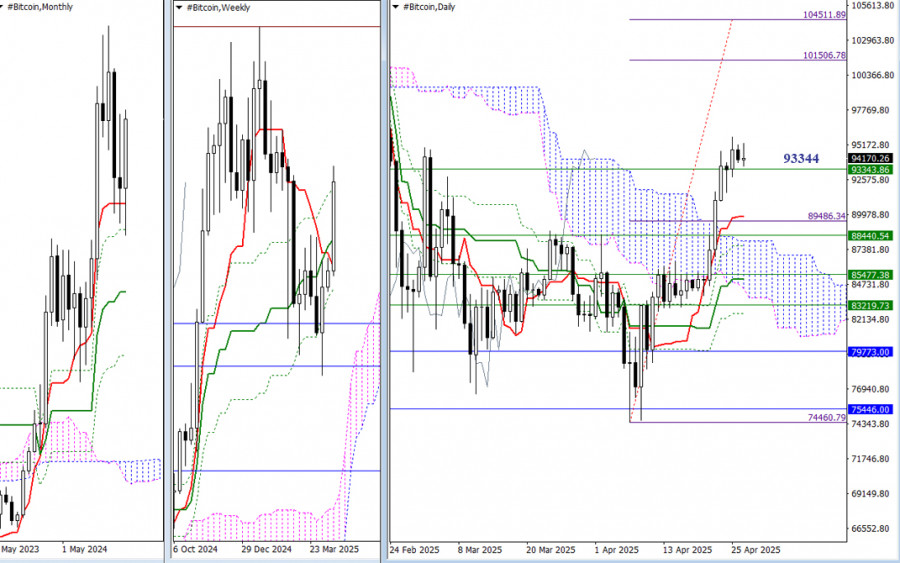
Currently, bullish players are attempting to change the situation and achieve bullish optimism for April. Last week, resistance at the final level of the weekly Ichimoku cross (93344) was tested, and on the daily timeframe, the price managed to consolidate above this level, closing the week higher. The elimination of the weekly “dead cross” will open up new prospects, which in the current situation can be noted at the levels of 101507–104512 (daily target for a cloud breakout) and 109986 (the last historical all-time high).
Failure by the bulls and a rebound from the encountered resistance (93344) will return the market to the zone of attraction and influence of the weekly and daily Ichimoku crosses, as well as the daily cloud. All these levels are currently concentrated around 89827–88441–85477–83220. This support zone is further reinforced by monthly levels 79774 (monthly short-term trend) and 75446 (monthly Fibonacci Kijun).
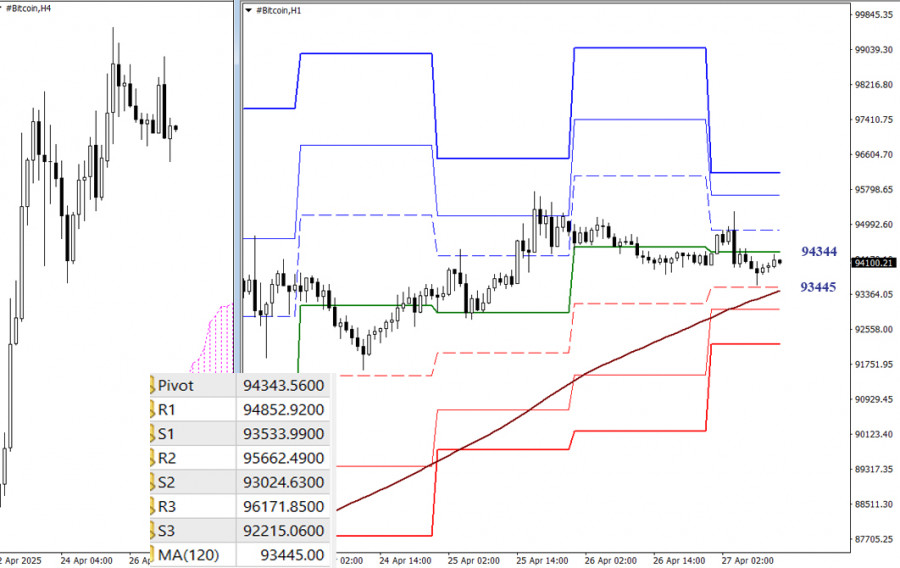
On the lower timeframes, the advantage still belongs to bullish players, but they are currently within a downward corrective zone and close to testing the weekly long-term trend (93445). A breakout and reversal of the trend could change the current balance of power. Classic Pivot levels provide additional intraday reference points. Bullish players will focus on resistances, while bearish players will monitor the classic Pivot supports.
***
Technical Analysis Components:
- Higher Timeframes: Ichimoku Kinko Hyo (9.26.52) and Fibonacci Kijun levels
- H1: Classic Pivot Points and 120-period Moving Average (weekly long-term trend)
The material has been provided by InstaForex Company – www.instaforex.comCurrently, bullish players are attempting to change the situation and achieve bullish optimism for April. Last week, resistance at the final level of the weekly Ichimoku cross (93344) was tested, and on the daily timeframe, the price managed to consolidate above this level, closing the week higher. The elimination of the weekly “dead cross” will open up new prospects, which in the current situation can be noted at the levels of 101507–104512 (daily target for a cloud breakout) and 109986 (the last historical all-time high).Failure by the bulls and a rebound from the encountered resistance (93344) will return the market to the zone of attraction and influence of the weekly and daily Ichimoku crosses, as well as the daily cloud. All these levels are currently concentrated around 89827–88441–85477–83220. This support zone is further reinforced by monthly levels 79774 (monthly short-term trend) and 75446 (monthly Fibonacci Kijun).On the lower timeframes, the advantage still belongs to bullish players, but they are currently within a downward corrective zone and close to testing the weekly long-term trend (93445). A breakout and reversal of the trend could change the current balance of power. Classic Pivot levels provide additional intraday reference points. Bullish players will focus on resistances, while bearish players will monitor the classic Pivot supports.***Technical Analysis Components:Higher Timeframes: Ichimoku Kinko Hyo (9.26.52) and Fibonacci Kijun levelsH1: Classic Pivot Points and 120-period Moving Average (weekly long-term trend)The material has been provided by InstaForex Company – www.instaforex.com Read More
Forex analysis review