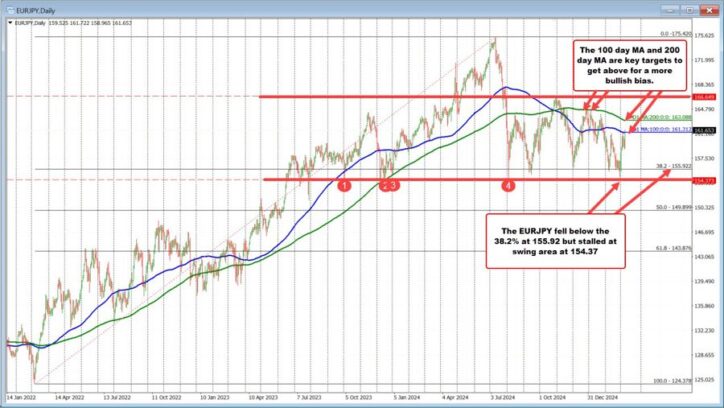
The EURJPY is breaking back above the 100 day MA on the daily chart (see blue line on the chart above). Last week, the price moved up to that MA and rotated lower.
Going back to the end of February on the chart above, the EURJPY found support at 154.37, a key swing area, after briefly dipping below the 38.2% Fibonacci retracement at 155.92. The bounce from this level has led to a recovery in March. Today, the pair now testing/breaking the 100-day MA (161.31) . The 200-day MA (163.08) is the next key target. The price of the EURJPY stalled against that MA in December and again in January. .
For a more bullish outlook, buyers need to break and hold above the 100-day moving averages, which would open the door toward resistance at the 200-day MA at 163.088. Failure to clear these levels could see a retracement back lower
This article was written by Greg Michalowski at www.forexlive.com.The EURJPY is breaking back above the 100 day MA on the daily chart (see blue line on the chart above). Last week, the price moved up to that MA and rotated lower. Going back to the end of February on the chart above, the EURJPY found support at 154.37, a key swing area, after briefly dipping below the 38.2% Fibonacci retracement at 155.92. The bounce from this level has led to a recovery in March. Today, the pair now testing/breaking the 100-day MA (161.31) . The 200-day MA (163.08) is the next key target. The price of the EURJPY stalled against that MA in December and again in January. .For a more bullish outlook, buyers need to break and hold above the 100-day moving averages, which would open the door toward resistance at the 200-day MA at 163.088. Failure to clear these levels could see a retracement back lower
This article was written by Greg Michalowski at www.forexlive.com. Read MoreTechnical Analysis
Forexlive RSS Breaking News Feed