
Over the past four days, the Dogecoin price is up more than 17% and is thus nearing bullish territory according to two renowned chart technicians. Rekt Capital (@rektcapital) and Henry (@LordOfAlts), are pointing to what they believe is a major technical setup on the Dogecoin (DOGE) price chart—potentially heralding a sizable breakout.
This Price Level Is Crucial For Dogecoin
Early today, Rekt Capital shared a weekly DOGE/USDT chart highlighting key price levels at $0.159, $0.204, and most critically $0.22. According to the analyst, Dogecoin’s trajectory now hinges on whether it can “reclaim and/or Weekly Close above $0.22”—a level he refers to as a green zone of Pre-Halving highs on his chart.
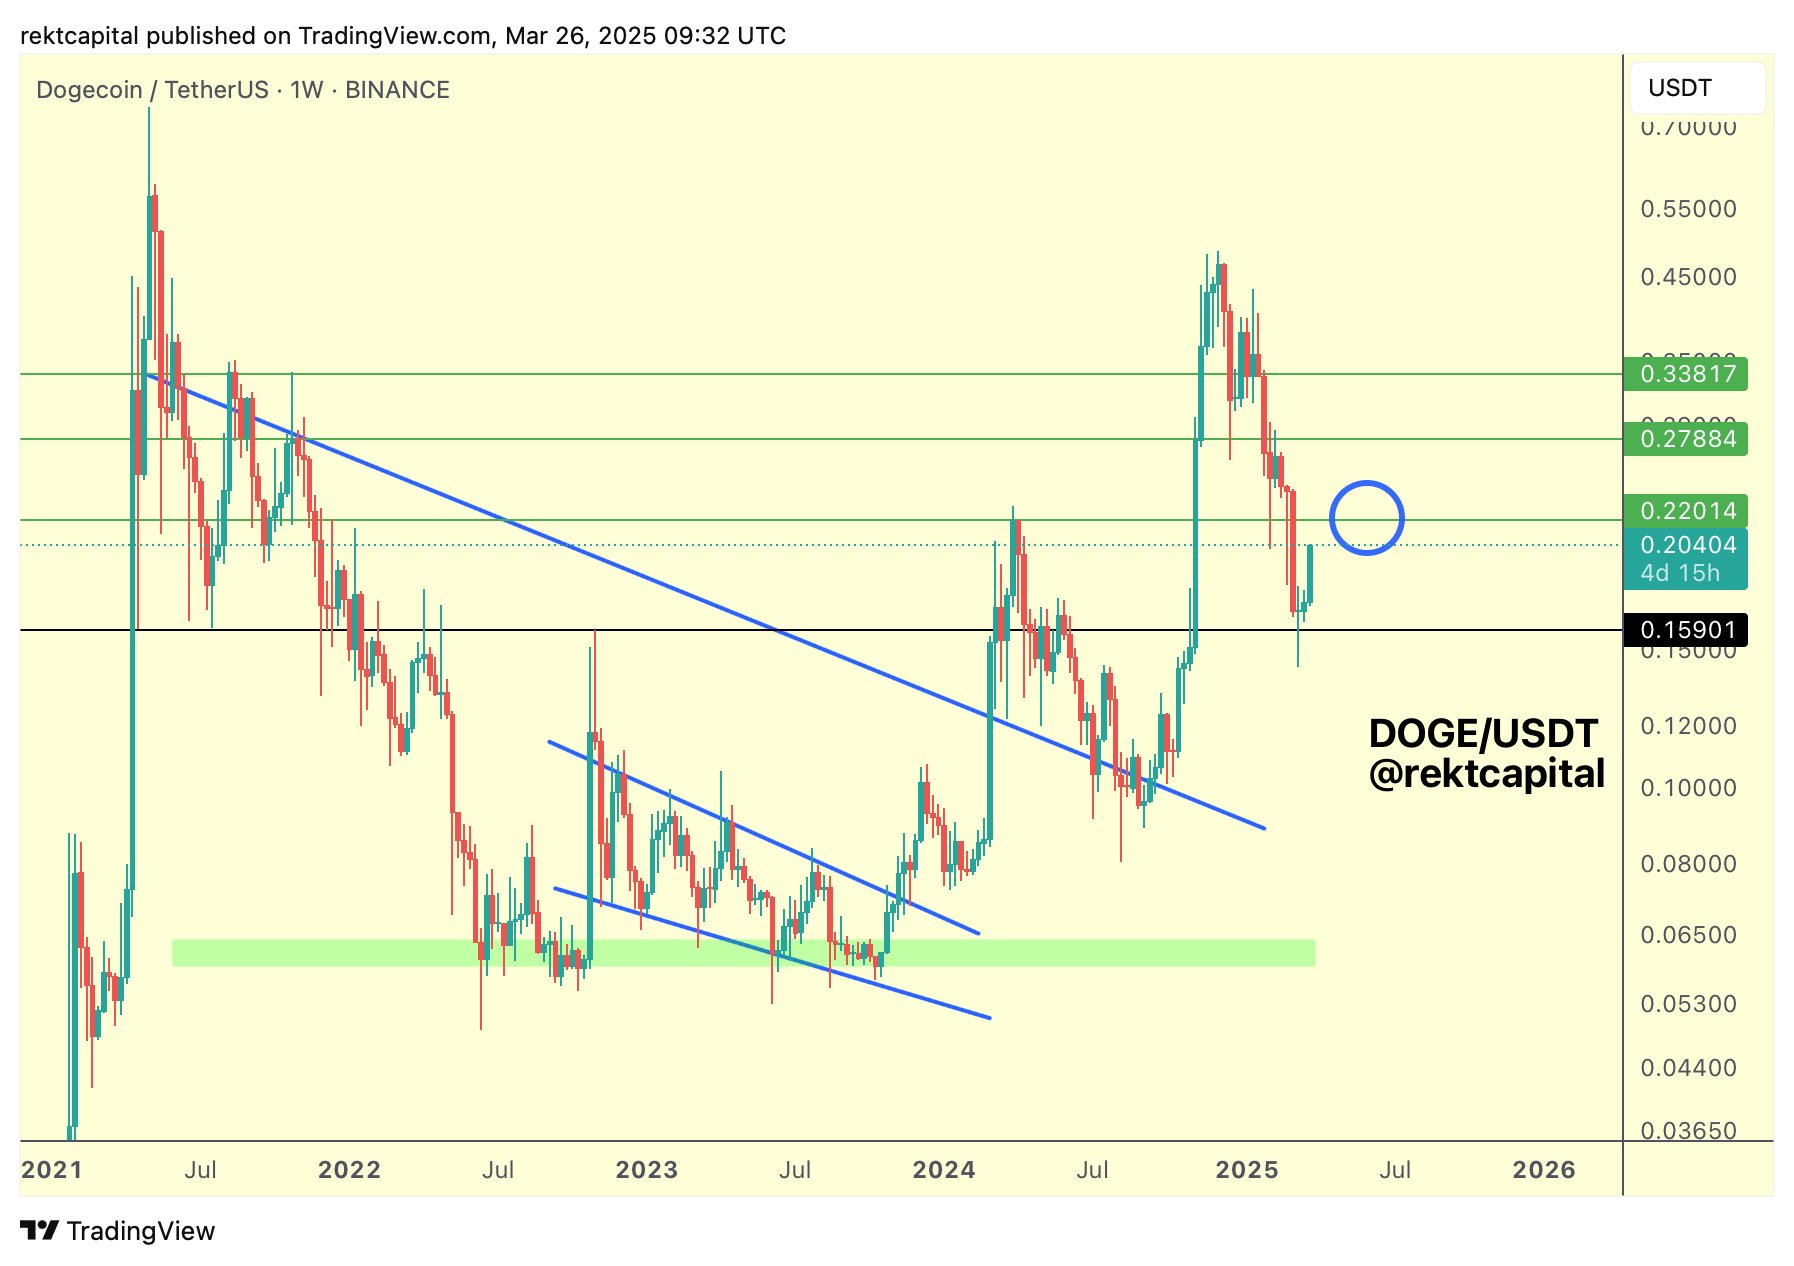
Rekt Capital suggests that the recent dip below $0.22 could represent a mere “downside deviation,” meaning any breach under that threshold might have been temporary if price action stabilizes above $0.22 in the near future. The candlesticks near $0.20 and $0.22 exhibit notable wicks, indicative of high volatility. Rekt Capital interprets these as part of a “very volatile retest” of the price region around March highs.
From a technical standpoint, the $0.22 area seems to act as a pivot. Should Dogecoin close a weekly candle above that boundary, it would increase the likelihood that buyers are regaining control, potentially setting the stage for a move toward higher resistance levels—such as the $0.28 and $0.338 region, identified by two horizontal green lines on Rekt Capital’s chart.
DOGE Breakout Already Confirmed?
Meanwhile, analyst Henry (@LordOfAlts) points to a multi-month falling wedge formation stretching from late 2024 through the first quarter of 2025. Henry notes that this pattern bears resemblance to Dogecoin’s descending wedge in 2024, which eventually led to a breakout and a significant price surge.
On Henry’s chart, DOGE had been consolidating between two downward-sloping trendlines for several months. The upper trendline connects lower highs since the coin’s peak above $0.48, while the lower boundary captures a sequence of descending lows.
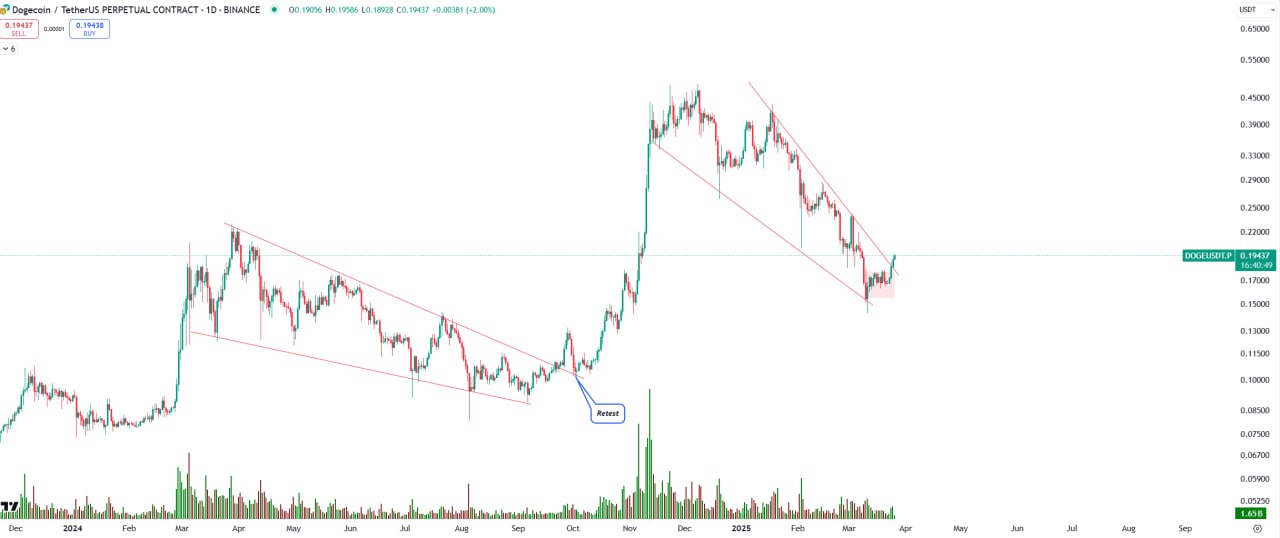
Henry’s analysis draws a parallel between the current wedge and a similar structure that resolved in a 365% surge which started in October 2024. Over the past few days, Dogecoin broke out of the falling wedge pattern again, possibly setting the stage for another steep rise.
Although Henry does not guarantee specific targets, he remarks that last time “Last time it did a similar thing was in Sep 24. 50¢ next, then $1.00,” concluding with a succinct instruction to “Trust the cycle.”
At press time, DOGE traded at $0.19583.
 Over the past four days, the Dogecoin price is up more than 17% and is thus nearing bullish territory according to two renowned chart technicians. Rekt Capital (@rektcapital) and Henry (@LordOfAlts), are pointing to what they believe is a major technical setup on the Dogecoin (DOGE) price chart—potentially heralding a sizable breakout. This Price Level Is Crucial For Dogecoin Early today, Rekt Capital shared a weekly DOGE/USDT chart highlighting key price levels at $0.159, $0.204, and most critically $0.22. According to the analyst, Dogecoin’s trajectory now hinges on whether it can “reclaim and/or Weekly Close above $0.22”—a level he refers to as a green zone of Pre-Halving highs on his chart. Rekt Capital suggests that the recent dip below $0.22 could represent a mere “downside deviation,” meaning any breach under that threshold might have been temporary if price action stabilizes above $0.22 in the near future. The candlesticks near $0.20 and $0.22 exhibit notable wicks, indicative of high volatility. Rekt Capital interprets these as part of a “very volatile retest” of the price region around March highs. Related Reading: Dogecoin Is ‘All Going To Plan,’ Says Crypto Analyst From a technical standpoint, the $0.22 area seems to act as a pivot. Should Dogecoin close a weekly candle above that boundary, it would increase the likelihood that buyers are regaining control, potentially setting the stage for a move toward higher resistance levels—such as the $0.28 and $0.338 region, identified by two horizontal green lines on Rekt Capital’s chart. DOGE Breakout Already Confirmed? Meanwhile, analyst Henry (@LordOfAlts) points to a multi-month falling wedge formation stretching from late 2024 through the first quarter of 2025. Henry notes that this pattern bears resemblance to Dogecoin’s descending wedge in 2024, which eventually led to a breakout and a significant price surge. Related Reading: Dogecoin Price Mirroring This 2017 Pattern Suggests That A Rise To $4 Could Happen On Henry’s chart, DOGE had been consolidating between two downward-sloping trendlines for several months. The upper trendline connects lower highs since the coin’s peak above $0.48, while the lower boundary captures a sequence of descending lows. Henry’s analysis draws a parallel between the current wedge and a similar structure that resolved in a 365% surge which started in October 2024. Over the past few days, Dogecoin broke out of the falling wedge pattern again, possibly setting the stage for another steep rise. Although Henry does not guarantee specific targets, he remarks that last time “Last time it did a similar thing was in Sep 24. 50¢ next, then $1.00,” concluding with a succinct instruction to “Trust the cycle.” At press time, DOGE traded at $0.19583. Featured image created with DALL.E, chart from TradingView.com Read MoreDogecoin, doge, DOGE news, Doge price, Dogecoin news, dogecoin price, Dogecoin price analysis
NewsBTC