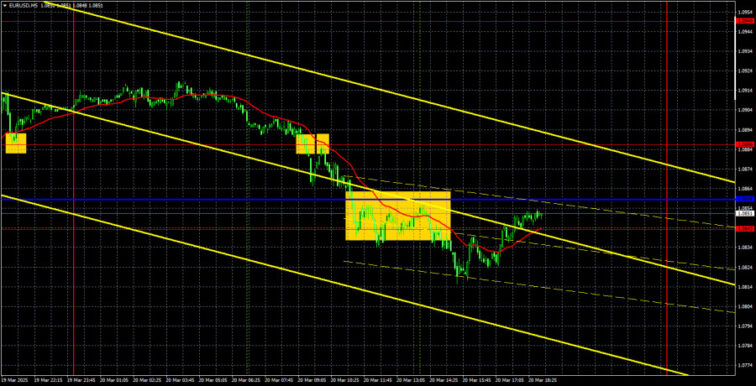
EUR/USD 5-Minute Analysis
On Thursday, the EUR/USD currency pair continued to frustrate traders. We believe this is not the best time to trade in the Forex market. The technical picture for the euro on the hourly timeframe is highly confusing. It seemed that yesterday, the price finally consolidated below the ascending channel. However, let us remind you that it had already broken through trend lines before, which did not lead to a downtrend. The price has dropped to the 1.0823 level, which can be considered the lower boundary of the sideways range between 1.0823 and 1.0949. So, instead of a completed uptrend, we now have an ongoing flat (sideways) market.
The market has essentially ignored the Federal Reserve meeting. The U.S. dollar had the opportunity to show decent growth, especially after a steep decline, but it didn’t happen.
Thus, the situation remains very complicated and unclear. The dollar is unwilling to grow under any circumstances. The market has long used macroeconomic reports only to buy euros. Donald Trump has not announced any new tariffs, but that doesn’t help the dollar. The Fed has taken a relatively hawkish stance, yet the dollar has shown only a formal rise. In addition, volatility is quite average at this time, and the pair is trading erratically — especially evident in the 5-minute timeframe.
On the 5-minute chart, the price spent most of Thursday in a downward trend—a sell signal formed around the 1.0886 level, which could be acted on. The Kijun-sen line and the 1.0843 level were then broken, though not without effort. However, after that, the euro’s decline halted—despite the bears seemingly holding all the cards. Some profit could have been made from the single short position, though likely not much.
COT Report
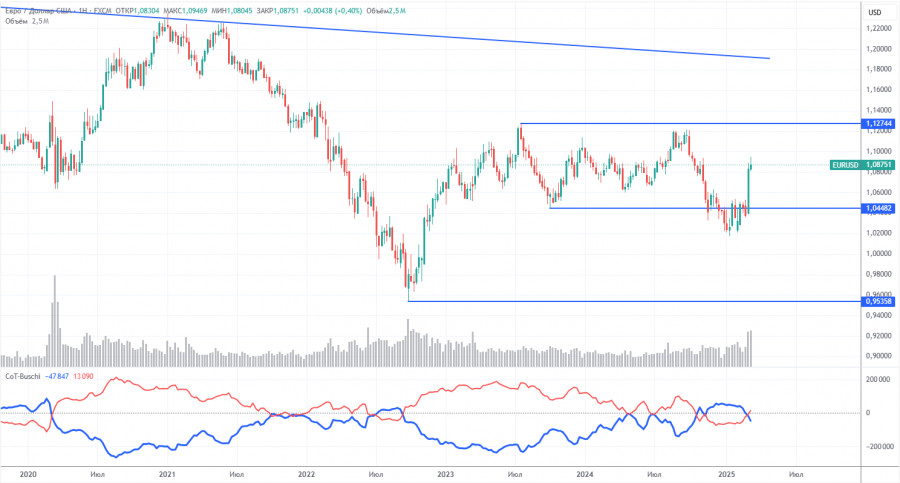
The latest COT report, dated March 11, indicates that the net position of non-commercial traders has remained “bullish” for an extended period. Bears have struggled to gain control, but bulls are now regaining the upper hand. The advantage that bears once had is diminishing as Trump takes office and the dollar continues to decline. While we cannot definitively predict that the dollar’s decline will persist, COT reports reflect the sentiment of major market players, which can change rapidly under current circumstances.
Although there are still no fundamental factors to justify a strengthening of the euro, one significant factor is currently weighing on the dollar. The EUR/USD pair may continue to correct for several weeks or even months, but it is unlikely that the 16-year downward trend will be reversed quickly.
At present, the red and blue lines have crossed again, indicating a “bullish” market trend. Over the last reporting week, long positions among non-commercial traders increased by 3,400, while short positions decreased by 19,800. As a result, the net position rose by another 23,200 contracts.
EUR/USD 1-Hour Analysis
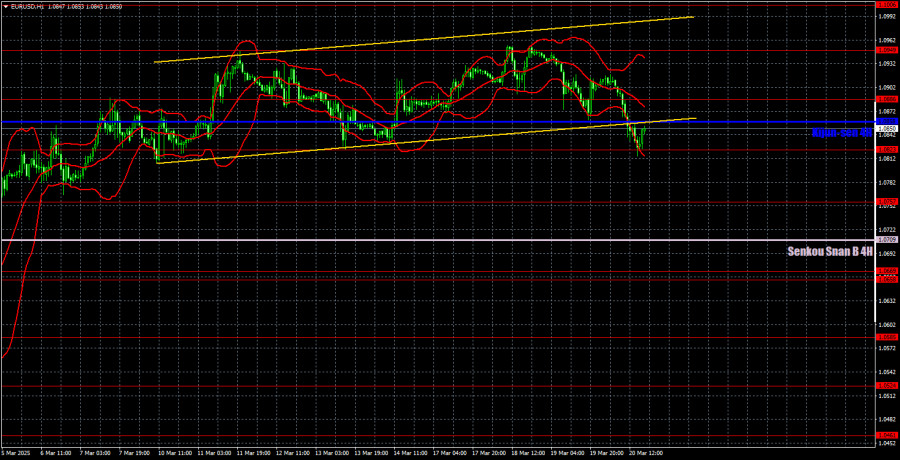
The price is already trading within a sideways range between 1.0823 and 1.0949 on the hourly timeframe. We believe the decline will resume in the medium term due to the divergence in monetary policy between the ECB and the Fed, but it’s unclear how long the market will continue reacting solely to the “Trump factor.” The current upward movement is already a market protest against Donald Trump, and where it will take the pair is unknown. Traders ignore many reports and news releases, and the dollar is sold off at every opportunity.
Trading levels for March 21: 1.0340–1.0366, 1.0461, 1.0524, 1.0585, 1.0658–1.0669, 1.0757, 1.0797, 1.0823, 1.0886, 1.0949, 1.1006, 1.1092, as well as Senkou Span B (1.0709) and Kijun-sen (1.0858). Note: Ichimoku indicator lines may shift during the day, which should be considered when identifying trading signals. Don’t forget to move your Stop Loss to breakeven once the price moves 15 pips in your favor — this helps protect against potential losses if the signal turns out to be false.
No significant events are scheduled in the Eurozone or the U.S. on Friday. Therefore, today’s movements could be even more chaotic than Thursday or Wednesday’s. For a downtrend to begin, the 1.0823 level must be breached. But how can that happen if traders are still unwilling to buy the dollar?
Illustration Explanations:
- Support and Resistance Levels (thick red lines): Thick red lines indicate where movement may come to an end. Please note that these lines are not sources of trading signals.
- Kijun-sen and Senkou Span B Lines: Ichimoku indicator lines transferred from the 4-hour timeframe to the hourly timeframe. These are strong lines.
- Extreme Levels (thin red lines): Thin red lines where the price has previously bounced. These serve as sources of trading signals.
- Yellow Lines: Trendlines, trend channels, or any other technical patterns.
- Indicator 1 on COT Charts: Represents the net position size for each category of traders.
The material has been provided by InstaForex Company – www.instaforex.comEUR/USD 5-Minute Analysis On Thursday, the EUR/USD currency pair continued to frustrate traders. We believe this is not the best time to trade in the Forex market. The technical picture for the euro on the hourly timeframe is highly confusing. It seemed that yesterday, the price finally consolidated below the ascending channel. However, let us remind you that it had already broken through trend lines before, which did not lead to a downtrend. The price has dropped to the 1.0823 level, which can be considered the lower boundary of the sideways range between 1.0823 and 1.0949. So, instead of a completed uptrend, we now have an ongoing flat (sideways) market.The market has essentially ignored the Federal Reserve meeting. The U.S. dollar had the opportunity to show decent growth, especially after a steep decline, but it didn’t happen.Thus, the situation remains very complicated and unclear. The dollar is unwilling to grow under any circumstances. The market has long used macroeconomic reports only to buy euros. Donald Trump has not announced any new tariffs, but that doesn’t help the dollar. The Fed has taken a relatively hawkish stance, yet the dollar has shown only a formal rise. In addition, volatility is quite average at this time, and the pair is trading erratically — especially evident in the 5-minute timeframe.On the 5-minute chart, the price spent most of Thursday in a downward trend—a sell signal formed around the 1.0886 level, which could be acted on. The Kijun-sen line and the 1.0843 level were then broken, though not without effort. However, after that, the euro’s decline halted—despite the bears seemingly holding all the cards. Some profit could have been made from the single short position, though likely not much.COT Report The latest COT report, dated March 11, indicates that the net position of non-commercial traders has remained “bullish” for an extended period. Bears have struggled to gain control, but bulls are now regaining the upper hand. The advantage that bears once had is diminishing as Trump takes office and the dollar continues to decline. While we cannot definitively predict that the dollar’s decline will persist, COT reports reflect the sentiment of major market players, which can change rapidly under current circumstances.Although there are still no fundamental factors to justify a strengthening of the euro, one significant factor is currently weighing on the dollar. The EUR/USD pair may continue to correct for several weeks or even months, but it is unlikely that the 16-year downward trend will be reversed quickly.At present, the red and blue lines have crossed again, indicating a “bullish” market trend. Over the last reporting week, long positions among non-commercial traders increased by 3,400, while short positions decreased by 19,800. As a result, the net position rose by another 23,200 contracts.EUR/USD 1-Hour Analysis The price is already trading within a sideways range between 1.0823 and 1.0949 on the hourly timeframe. We believe the decline will resume in the medium term due to the divergence in monetary policy between the ECB and the Fed, but it’s unclear how long the market will continue reacting solely to the “Trump factor.” The current upward movement is already a market protest against Donald Trump, and where it will take the pair is unknown. Traders ignore many reports and news releases, and the dollar is sold off at every opportunity.Trading levels for March 21: 1.0340–1.0366, 1.0461, 1.0524, 1.0585, 1.0658–1.0669, 1.0757, 1.0797, 1.0823, 1.0886, 1.0949, 1.1006, 1.1092, as well as Senkou Span B (1.0709) and Kijun-sen (1.0858). Note: Ichimoku indicator lines may shift during the day, which should be considered when identifying trading signals. Don’t forget to move your Stop Loss to breakeven once the price moves 15 pips in your favor — this helps protect against potential losses if the signal turns out to be false.No significant events are scheduled in the Eurozone or the U.S. on Friday. Therefore, today’s movements could be even more chaotic than Thursday or Wednesday’s. For a downtrend to begin, the 1.0823 level must be breached. But how can that happen if traders are still unwilling to buy the dollar?Illustration Explanations:Support and Resistance Levels (thick red lines): Thick red lines indicate where movement may come to an end. Please note that these lines are not sources of trading signals.Kijun-sen and Senkou Span B Lines: Ichimoku indicator lines transferred from the 4-hour timeframe to the hourly timeframe. These are strong lines.Extreme Levels (thin red lines): Thin red lines where the price has previously bounced. These serve as sources of trading signals.Yellow Lines: Trendlines, trend channels, or any other technical patterns.Indicator 1 on COT Charts: Represents the net position size for each category of traders.The material has been provided by InstaForex Company – www.instaforex.com Read More
Forex analysis review