EUR/USD 5-Minute Analysis
The EUR/USD currency pair continued its upward movement on Wednesday, but calling it a “movement” is an understatement. Without strong macroeconomic justification, the U.S. dollar has fallen by 400 pips in a few days. The dollar’s collapse is solely due to decisions and statements made by U.S. President Donald Trump—something that is now evident to every trader. As a result, analyzing Wednesday’s macroeconomic data is pointless. The day’s most important report, the ISM Services PMI, significantly exceeded forecasts yet did nothing to strengthen the dollar. This means that technical, macroeconomic, and fundamental analyses are currently irrelevant. We are witnessing an extremely rare phenomenon where political and geopolitical factors—stemming from just one country—are creating unprecedented chaos across global markets.
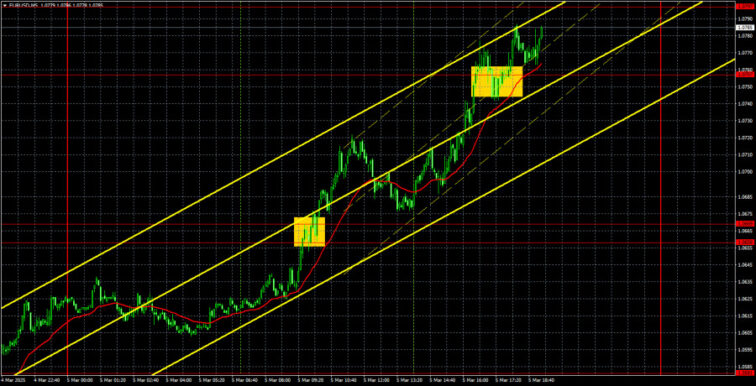
On Wednesday, two trading signals formed on the 5-minute chart: first, the pair broke through the 1.0658-1.0669 range, then surpassed the 1.0757 level. These signals could have been traded, but remembering that the current rally has nothing to do with technicals, macroeconomics, or fundamentals is worth remembering. The pair is skyrocketing, and the formation of decent trading signals is more of a coincidence. It is impossible to predict how long this dollar collapse will last, as Trump could continue to “surprise” the markets with new statements every day.
COT Report
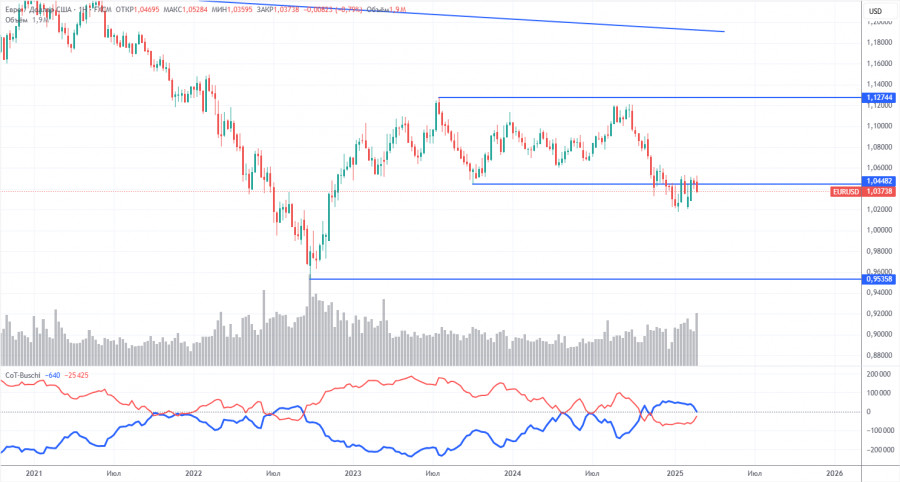
The latest Commitment of Traders (COT) report is dated February 25. The illustration above clearly shows that non-commercial traders have maintained a bullish net position for an extended period; however, bears have now taken the lead. Three months ago, professional traders significantly increased their short positions, causing the net position to turn negative for the first time in a while. This indicates that the euro is currently being sold more often than it is being bought, and bearish sentiment continues to dominate the market.
There are still no fundamental factors supporting a strengthening of the euro. The recent upward movement observed on the weekly timeframe is minimal and appears to be merely a technical correction. The long-term downward trend, which has persisted for 16 years, remains intact, even if the pair experiences correction for several more weeks or months.
At present, the red and blue lines have crossed and reversed their positions relative to each other, signaling a bearish trend in the market. During the last reporting week, long positions among the “non-commercial” group increased by 12,400, while short positions decreased by 13,600. Consequently, the net position rose by 26,000 contracts; however, this change has not yet influenced the overall market sentiment.
EUR/USD 1-Hour Analysis
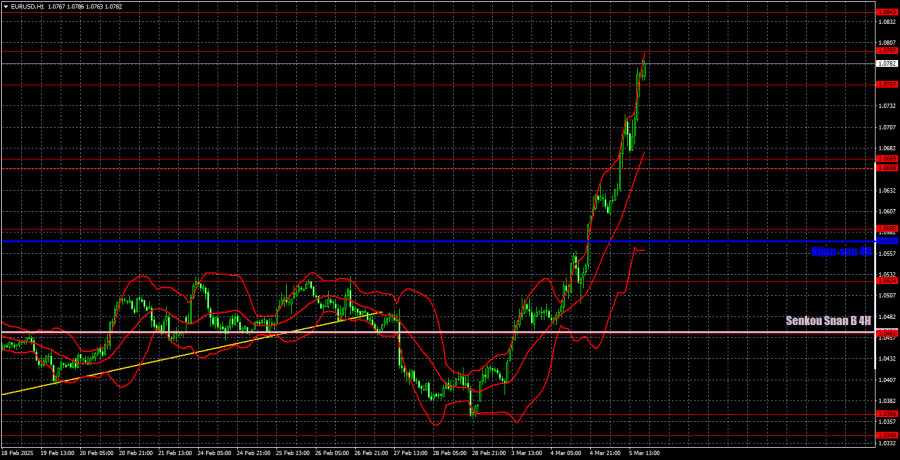
On the hourly timeframe, the pair continues its vertical ascent. We believe that in the medium term, the dollar’s decline will reverse due to the divergence in monetary policy between the European Central Bank and the Federal Reserve. However, the current movement is pure market panic, and no one knows where it will take the pair. Traders ignore everything except Trump’s remarks, and the dollar is being sold at any price. The movement is now nearly vertical.
For March 6, the key trading levels are 1.0269, 1.0340-1.0366, 1.0461, 1.0524, 1.0585, 1.0658-1.0669, 1.0757, 1.0797, 1.0843, 1.0889, and 1.0935, as well as the Senkou Span B (1.0464) and Kijun-sen (1.0571) lines. The Ichimoku indicator lines may shift throughout the day, so this should be considered when identifying trading signals. Don’t forget to place a Stop Loss at breakeven if the price moves 15 pips in the right direction—this will help mitigate potential losses in case of a false signal.
The ECB meeting and retail sales report are scheduled for release in the Eurozone and the U.S. on Thursday. But does anyone even care about that anymore? Even if the ECB were to cut rates to zero immediately, it’s unlikely to have any impact on the market. Current movements are entirely emotional and unpredictable.
Illustration Explanations:
- Support and Resistance Levels (thick red lines): Thick red lines indicate where movement may come to an end. Please note that these lines are not sources of trading signals.
- Kijun-sen and Senkou Span B Lines: Ichimoku indicator lines transferred from the 4-hour timeframe to the hourly timeframe. These are strong lines.
- Extreme Levels (thin red lines): Thin red lines where the price has previously bounced. These serve as sources of trading signals.
- Yellow Lines: Trendlines, trend channels, or any other technical patterns.
- Indicator 1 on COT Charts: Represents the net position size for each category of traders.
The material has been provided by InstaForex Company – www.instaforex.comEUR/USD 5-Minute Analysis The EUR/USD currency pair continued its upward movement on Wednesday, but calling it a “movement” is an understatement. Without strong macroeconomic justification, the U.S. dollar has fallen by 400 pips in a few days. The dollar’s collapse is solely due to decisions and statements made by U.S. President Donald Trump—something that is now evident to every trader. As a result, analyzing Wednesday’s macroeconomic data is pointless. The day’s most important report, the ISM Services PMI, significantly exceeded forecasts yet did nothing to strengthen the dollar. This means that technical, macroeconomic, and fundamental analyses are currently irrelevant. We are witnessing an extremely rare phenomenon where political and geopolitical factors—stemming from just one country—are creating unprecedented chaos across global markets.On Wednesday, two trading signals formed on the 5-minute chart: first, the pair broke through the 1.0658-1.0669 range, then surpassed the 1.0757 level. These signals could have been traded, but remembering that the current rally has nothing to do with technicals, macroeconomics, or fundamentals is worth remembering. The pair is skyrocketing, and the formation of decent trading signals is more of a coincidence. It is impossible to predict how long this dollar collapse will last, as Trump could continue to “surprise” the markets with new statements every day.COT Report The latest Commitment of Traders (COT) report is dated February 25. The illustration above clearly shows that non-commercial traders have maintained a bullish net position for an extended period; however, bears have now taken the lead. Three months ago, professional traders significantly increased their short positions, causing the net position to turn negative for the first time in a while. This indicates that the euro is currently being sold more often than it is being bought, and bearish sentiment continues to dominate the market.There are still no fundamental factors supporting a strengthening of the euro. The recent upward movement observed on the weekly timeframe is minimal and appears to be merely a technical correction. The long-term downward trend, which has persisted for 16 years, remains intact, even if the pair experiences correction for several more weeks or months.At present, the red and blue lines have crossed and reversed their positions relative to each other, signaling a bearish trend in the market. During the last reporting week, long positions among the “non-commercial” group increased by 12,400, while short positions decreased by 13,600. Consequently, the net position rose by 26,000 contracts; however, this change has not yet influenced the overall market sentiment.EUR/USD 1-Hour Analysis On the hourly timeframe, the pair continues its vertical ascent. We believe that in the medium term, the dollar’s decline will reverse due to the divergence in monetary policy between the European Central Bank and the Federal Reserve. However, the current movement is pure market panic, and no one knows where it will take the pair. Traders ignore everything except Trump’s remarks, and the dollar is being sold at any price. The movement is now nearly vertical.For March 6, the key trading levels are 1.0269, 1.0340-1.0366, 1.0461, 1.0524, 1.0585, 1.0658-1.0669, 1.0757, 1.0797, 1.0843, 1.0889, and 1.0935, as well as the Senkou Span B (1.0464) and Kijun-sen (1.0571) lines. The Ichimoku indicator lines may shift throughout the day, so this should be considered when identifying trading signals. Don’t forget to place a Stop Loss at breakeven if the price moves 15 pips in the right direction—this will help mitigate potential losses in case of a false signal.The ECB meeting and retail sales report are scheduled for release in the Eurozone and the U.S. on Thursday. But does anyone even care about that anymore? Even if the ECB were to cut rates to zero immediately, it’s unlikely to have any impact on the market. Current movements are entirely emotional and unpredictable.Illustration Explanations:Support and Resistance Levels (thick red lines): Thick red lines indicate where movement may come to an end. Please note that these lines are not sources of trading signals.Kijun-sen and Senkou Span B Lines: Ichimoku indicator lines transferred from the 4-hour timeframe to the hourly timeframe. These are strong lines.Extreme Levels (thin red lines): Thin red lines where the price has previously bounced. These serve as sources of trading signals.Yellow Lines: Trendlines, trend channels, or any other technical patterns.Indicator 1 on COT Charts: Represents the net position size for each category of traders.The material has been provided by InstaForex Company – www.instaforex.com Read More
Forex analysis review